Meet your new statistics app.
statscloud is a modern, cross-platform stats app with free and unlimited access for everyone on any device.

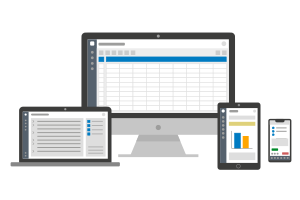
statscloud is a modern, cross-platform stats app with free and unlimited access for everyone on any device.
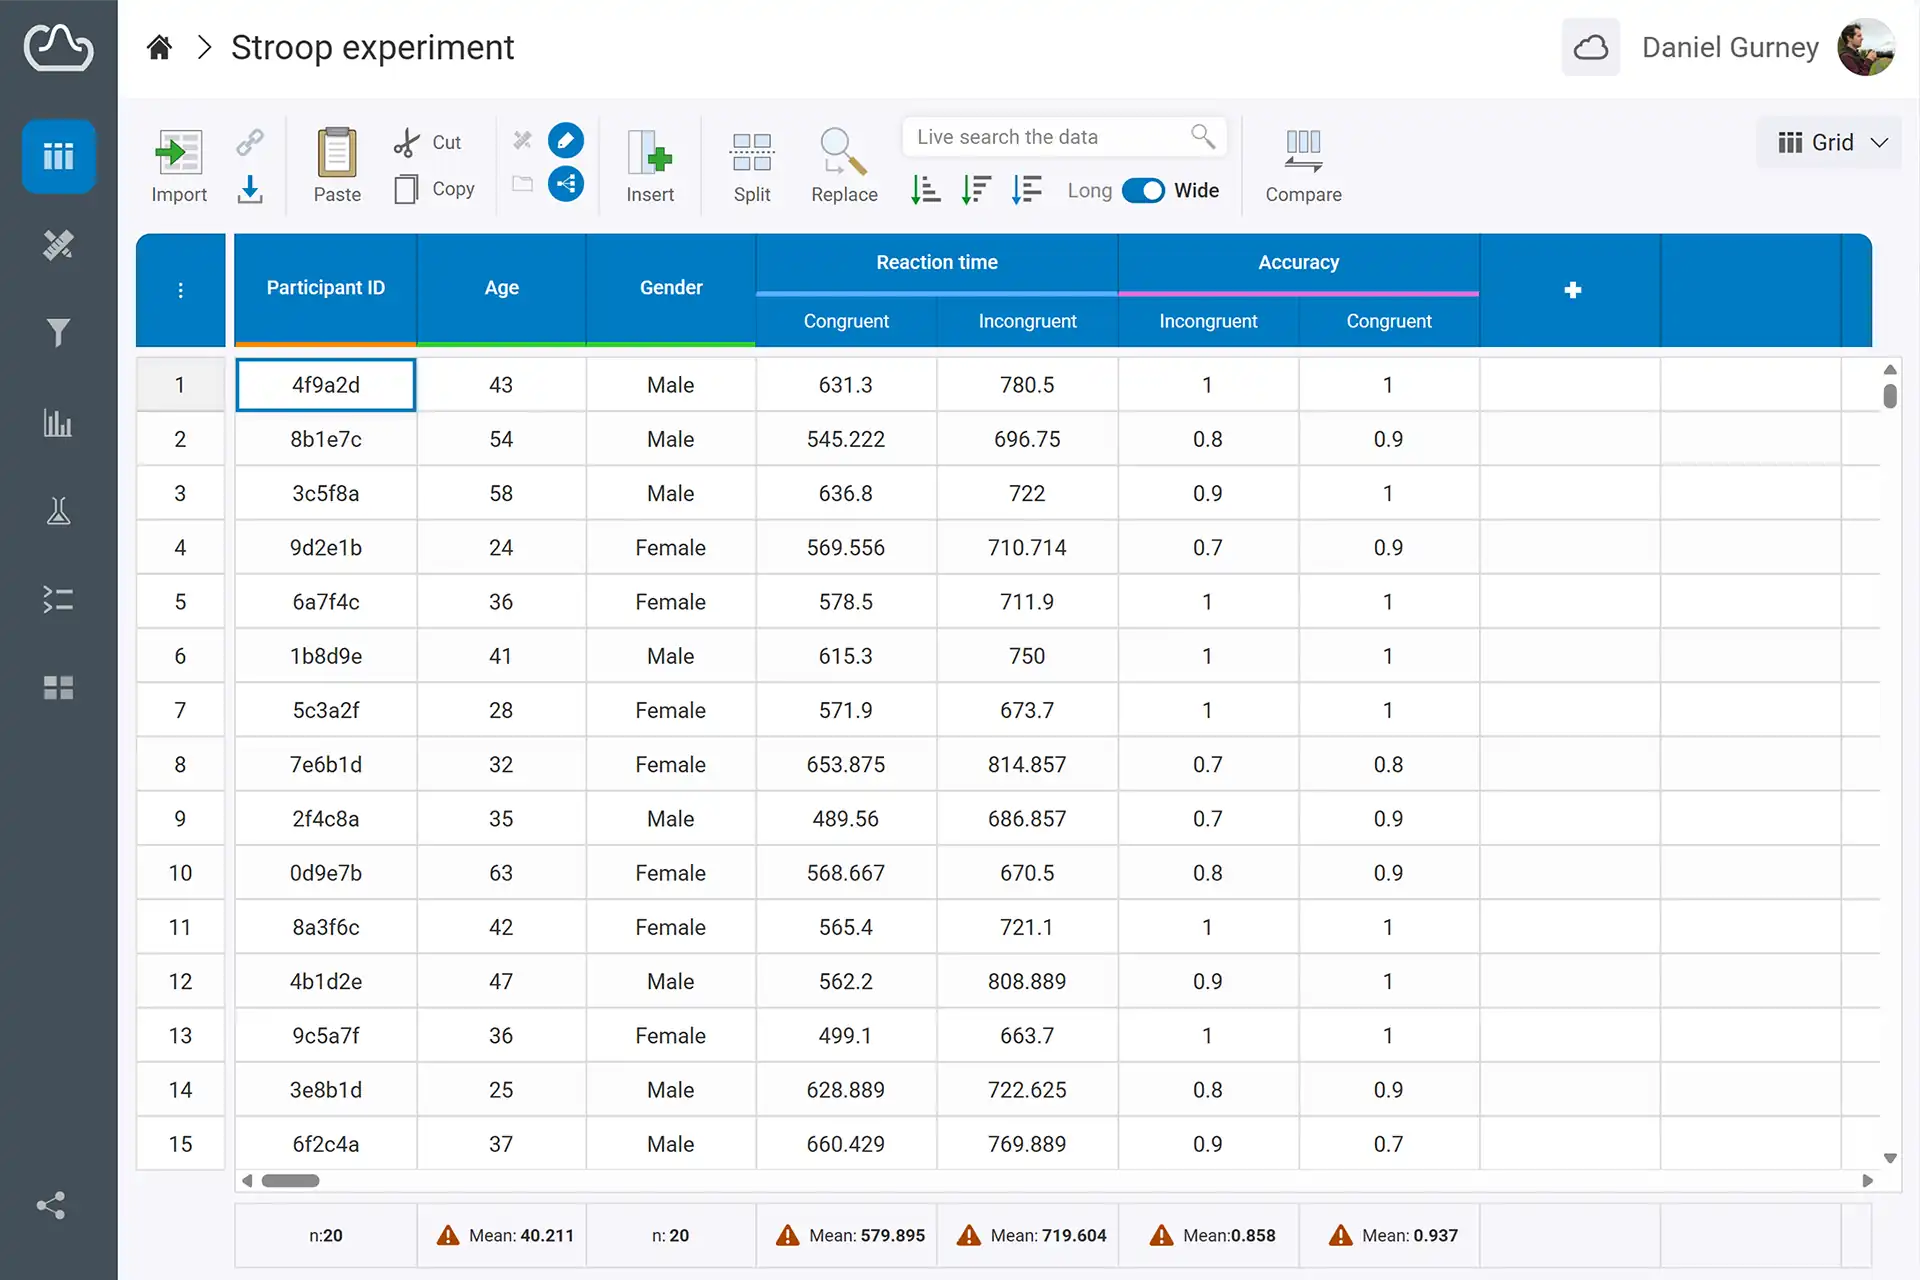
The new standard in statistics software
statscloud is a modern statistics package designed for social scientists. It's free to use by anyone on any device at any time without any limits.
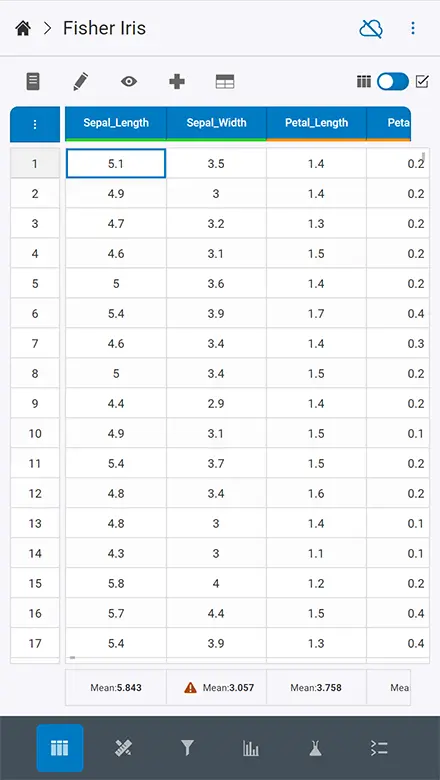
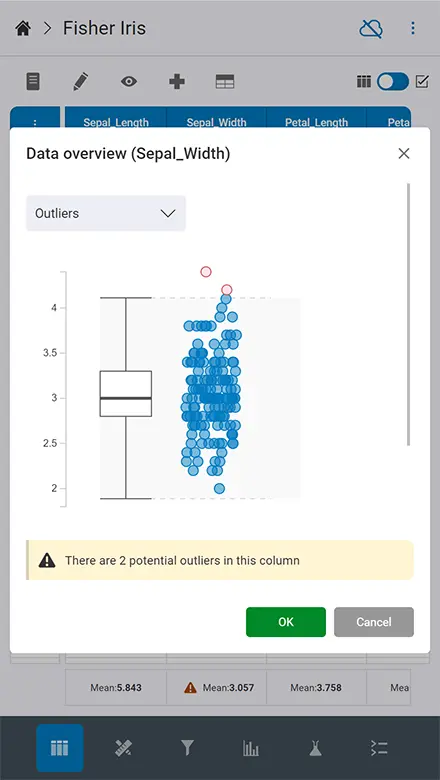
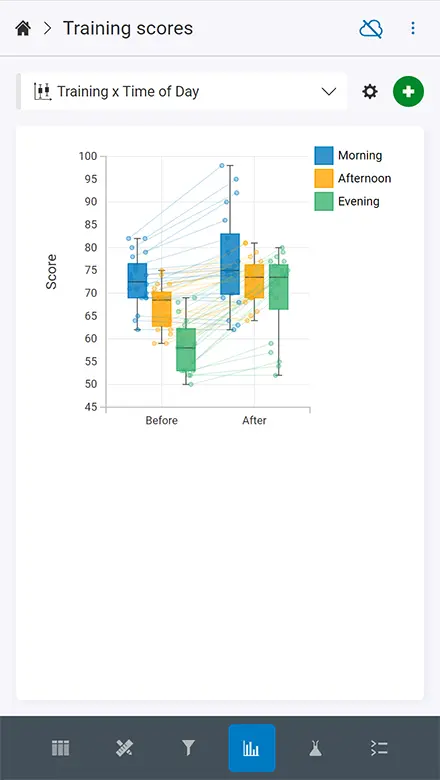
The app has a beautiful, slick interface that works on all devices, and has a responsive design that will adapt to any screen you're using.
statscloud performs a wide variety of statistical analyses powered by JavaScript, R, and Python, and as an in-built terminal for advanced users.
A better way to run analyses
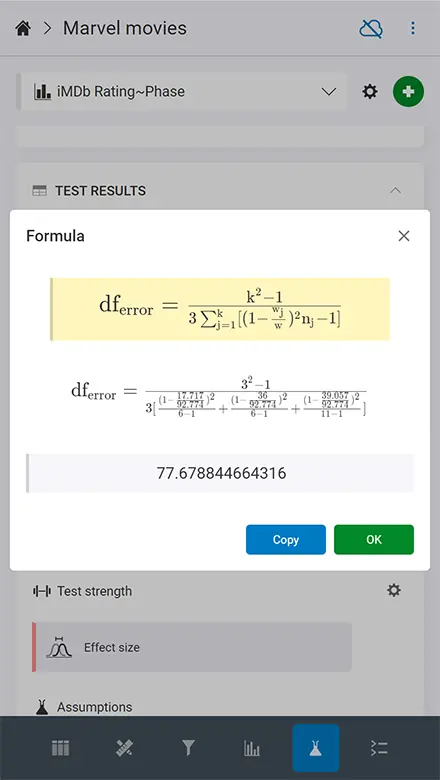
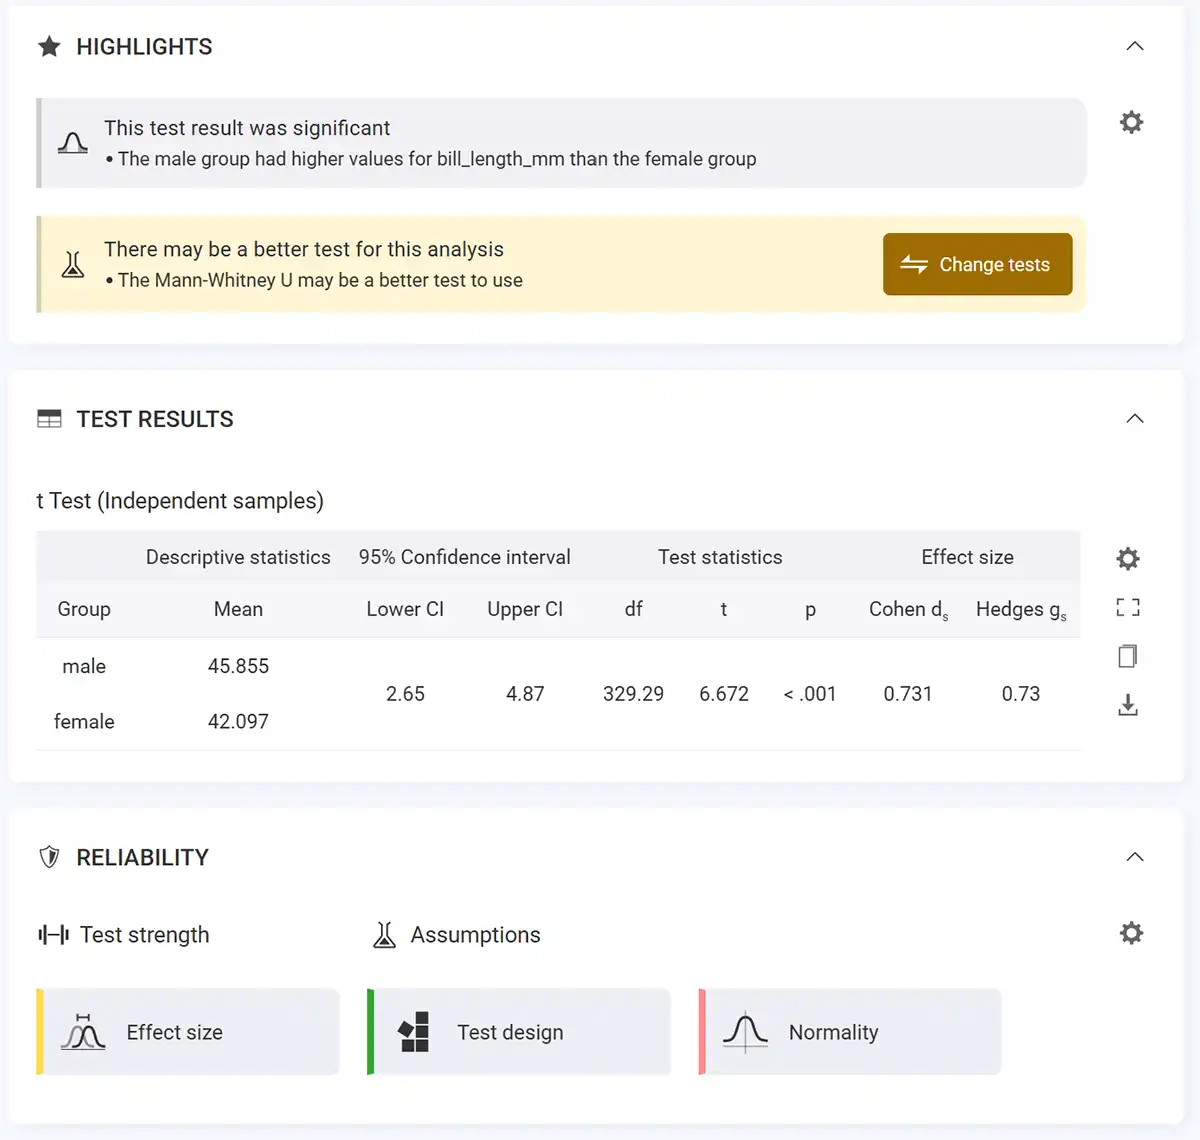
We've moved on from the "tick-box" interface used by older stats apps, so now you never need to click through a long list of options to run a test or view the results across two separate interfaces.
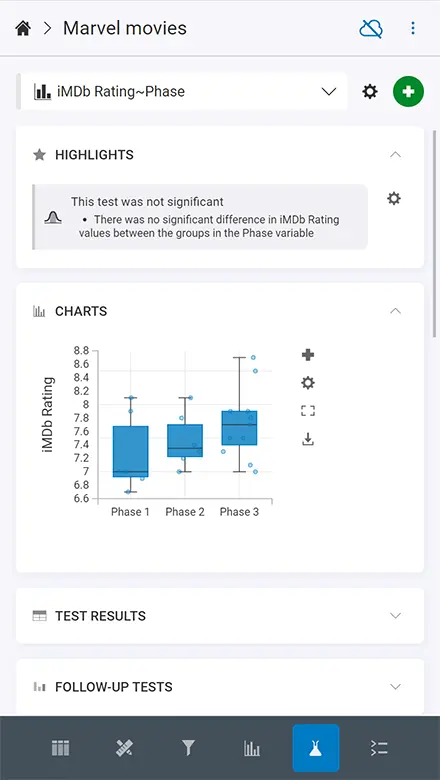
Analyses in statscloud are much more intuitive: You can set up a new test with a few clicks and explore your results in an interactive summary.
 View an example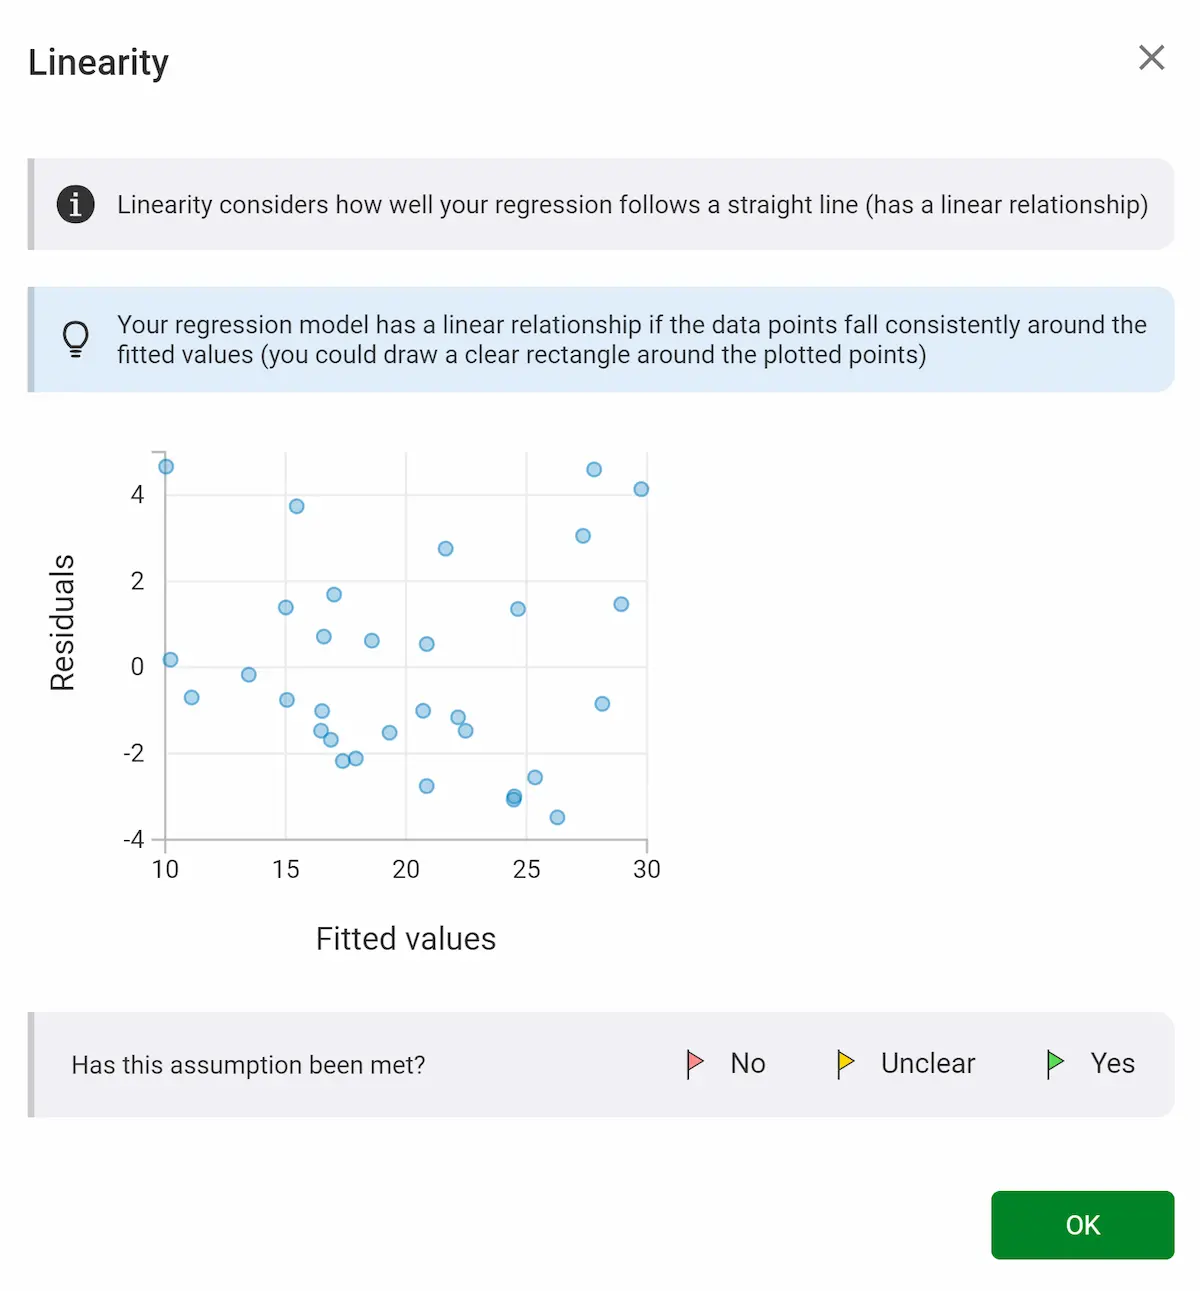
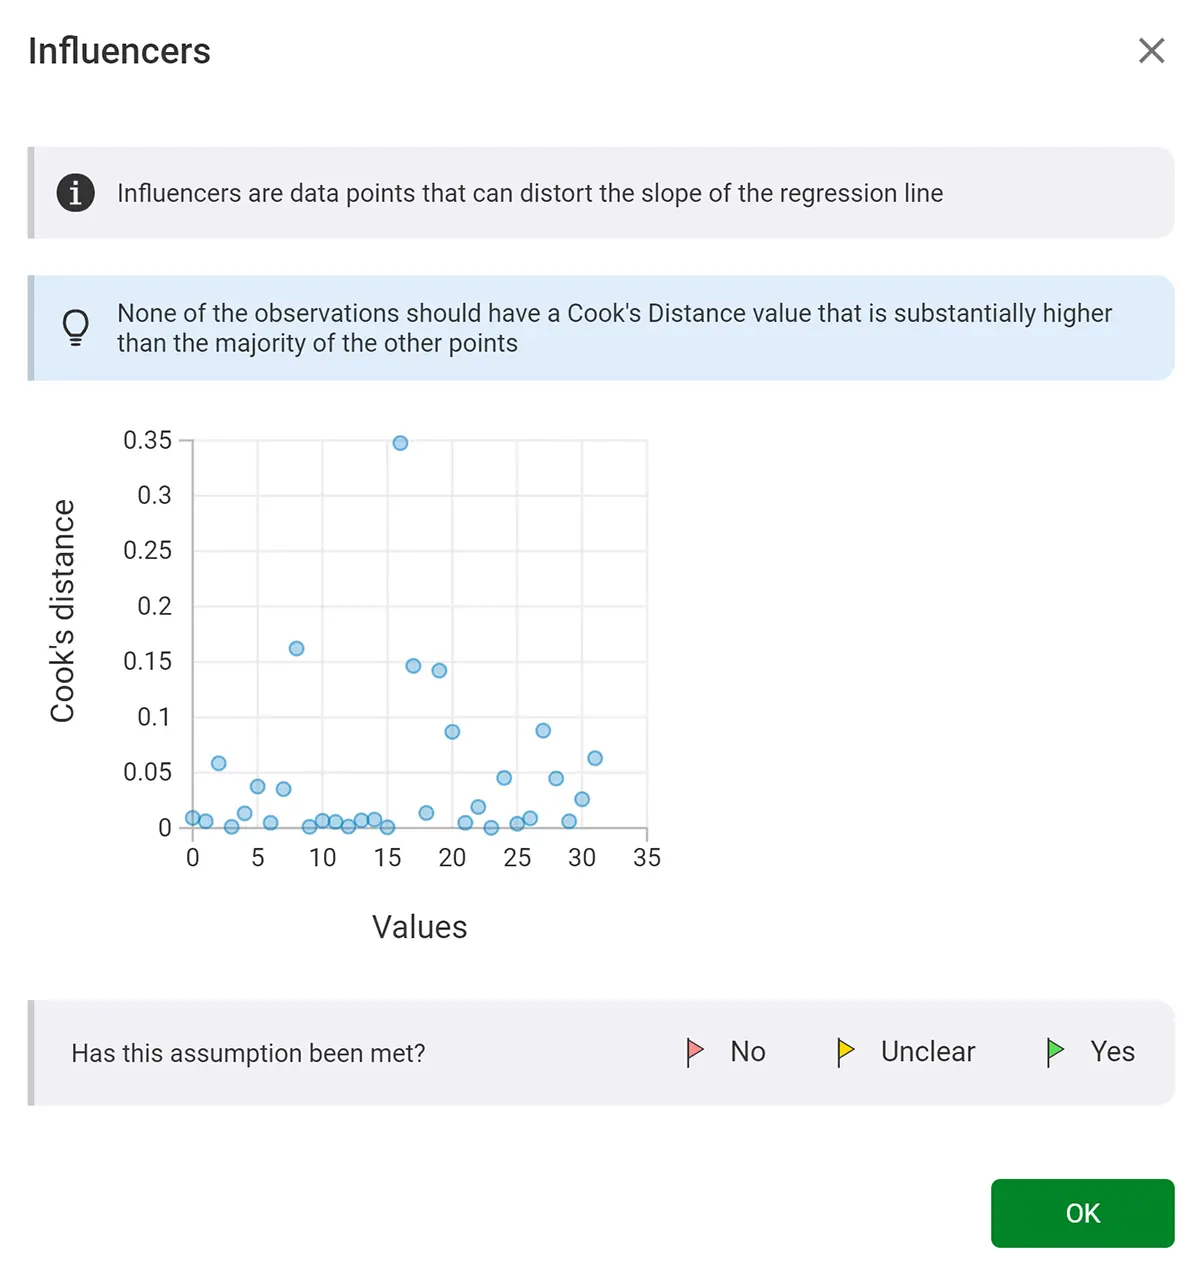
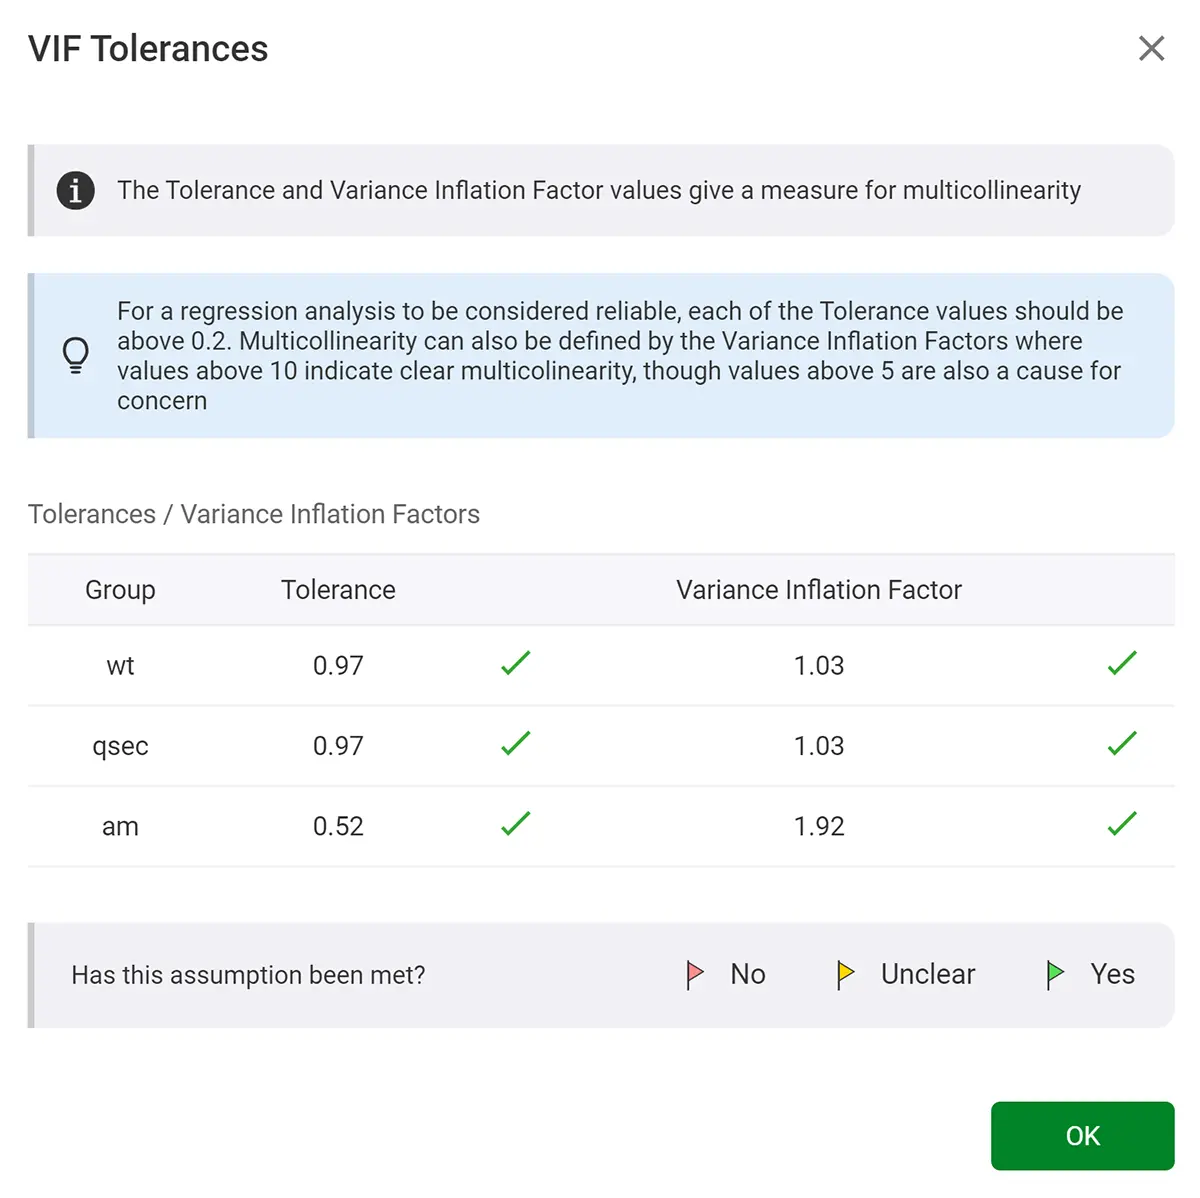
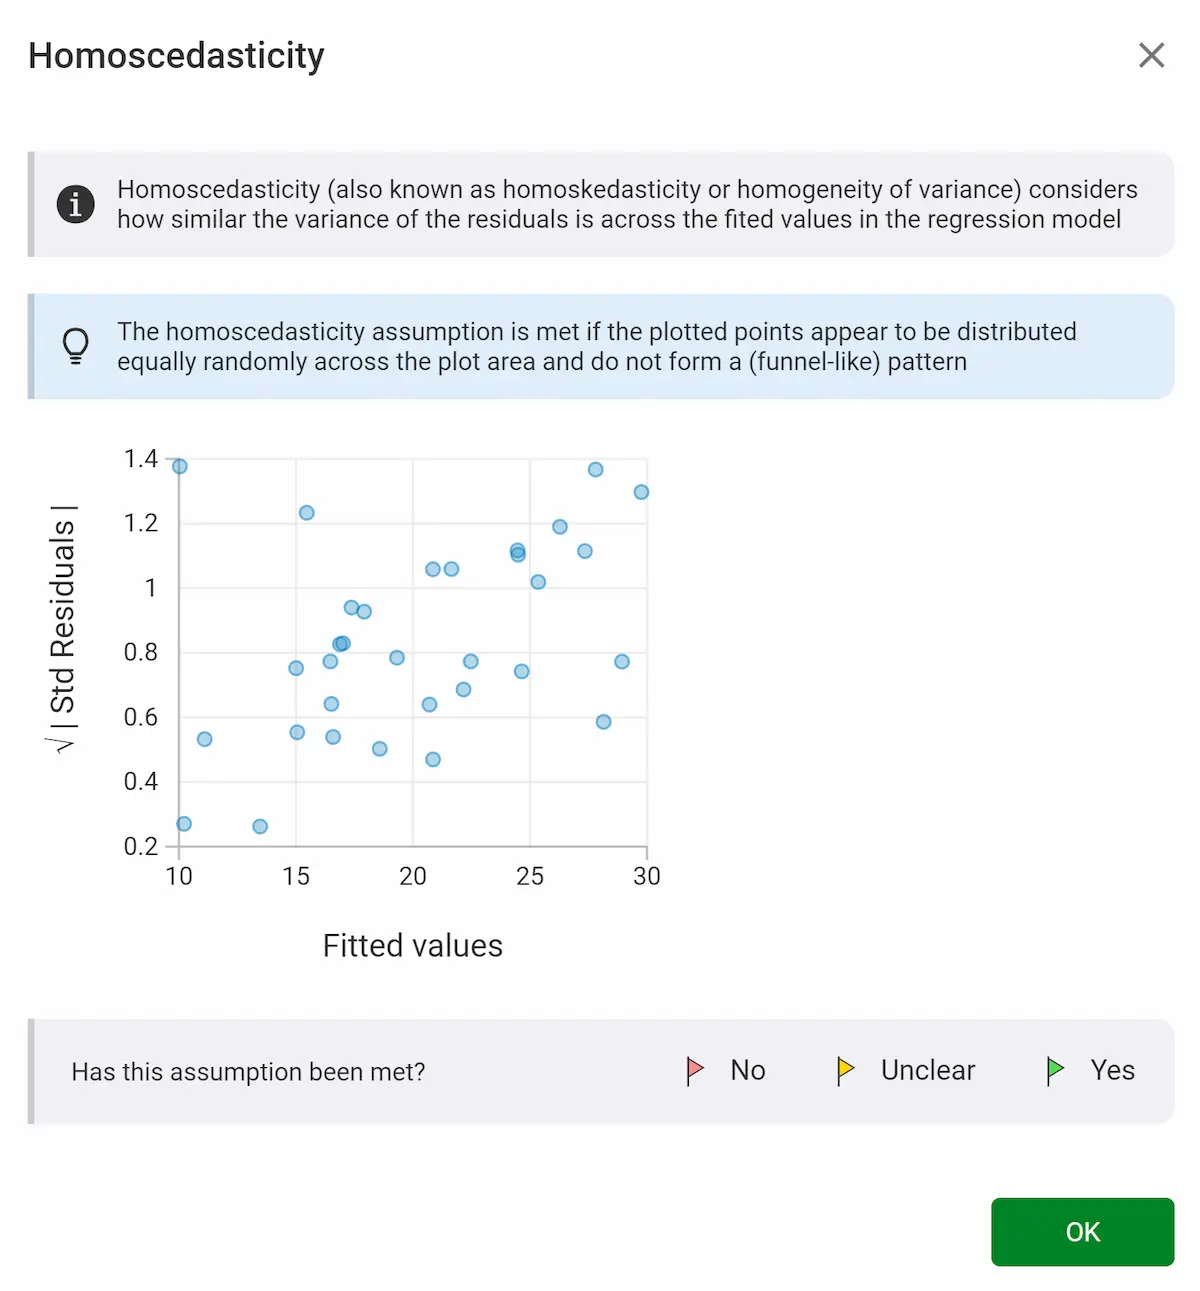
Our analysis summaries let you to delve into analyses like never before. They break up your analysis into individual sections and explain everything to you in context.
Using our interactive reliability tests, you can go through each test assumption manually and make an informed decision about whether the results you've found are meaningful. The app guides you through each of your tests carefully to ensure you understand everything in full and have completed the test accurately.
All of these features are unique to statscloud and are there to make sure your statistical analysis much easier to digest and interpret.

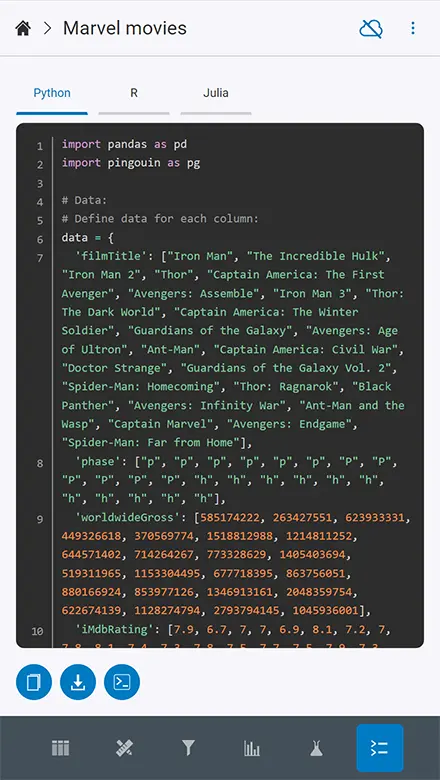
All the code to run an analysis in R or Python is available right inside the app. No need to search for it in a repository.

Write your own analysis modules inside the app. No third-party software or tools required.

No hidden paywalls or extra costs for additional capacity. Free and unlimited access to everyone on any device.

Share your whole project with a single link available to everyone without the need to install an app or create an account.
The future of statistics software
statscloud is already leading the way in the development of a modern statistics app and is establishing itself as the new standard in statistics software.
Our aim is to be the most widely-used app for teaching statistics. Ultimately, we want to help bridge users over to programming languages so they have the best start in becoming professional statisticians.
We're very grateful to everyone who has supported us on this journey and we look forward to having you join us on it!
 Start a new project
Rapidly rising popularity
With thousands of new users every month, we believe statscloud is the one of the fastest-growing statistics software packages available today.
When users have switched to statscloud, they tend to continue using it throughout their educational and professional journeys. Because of this, we expect it's growth to continue to rise rapidly.








| Feature | Free cloud tier on standard stats app | Free | PRO |
|---|---|---|---|
| Unlimited access No queues, no session limits, and no idle timeout limits |  | ||
| Install anywhere Access through an app with a custom interface for any device | | ||
| Code terminal Access an R and Python terminal inside the app | | ||
| Share Share your whole projects with a single permanent link | | ||
| Cloud-save projects Save your projects securely to your own dashboard inside the app | | | |
| Libraries Create your own personal library of variables and chart themes | | |
Get even more out of statscloud
statscloud is the only statistics app to offer truly unlimited access on every device (desktops, laptops, Chromebooks, tablets, and phones) with no hidden costs or paywalls.
While a subscription to statscloud PRO is not needed to benefit from full, unrestricted access to the app, it provides access to some unique and exclusive features never before seen in statistics software.
If you need lots of PRO user accounts or would like to customise the app, try self-hosting your own statscloud!
 Sign up for PRO